AVI 2.0 — Visibility
AVI 2.0 (The True Performance Scorecard)
AVI 2.0 answers a simple question: Did this ad actually work for humans, or did it just exist in their environment?
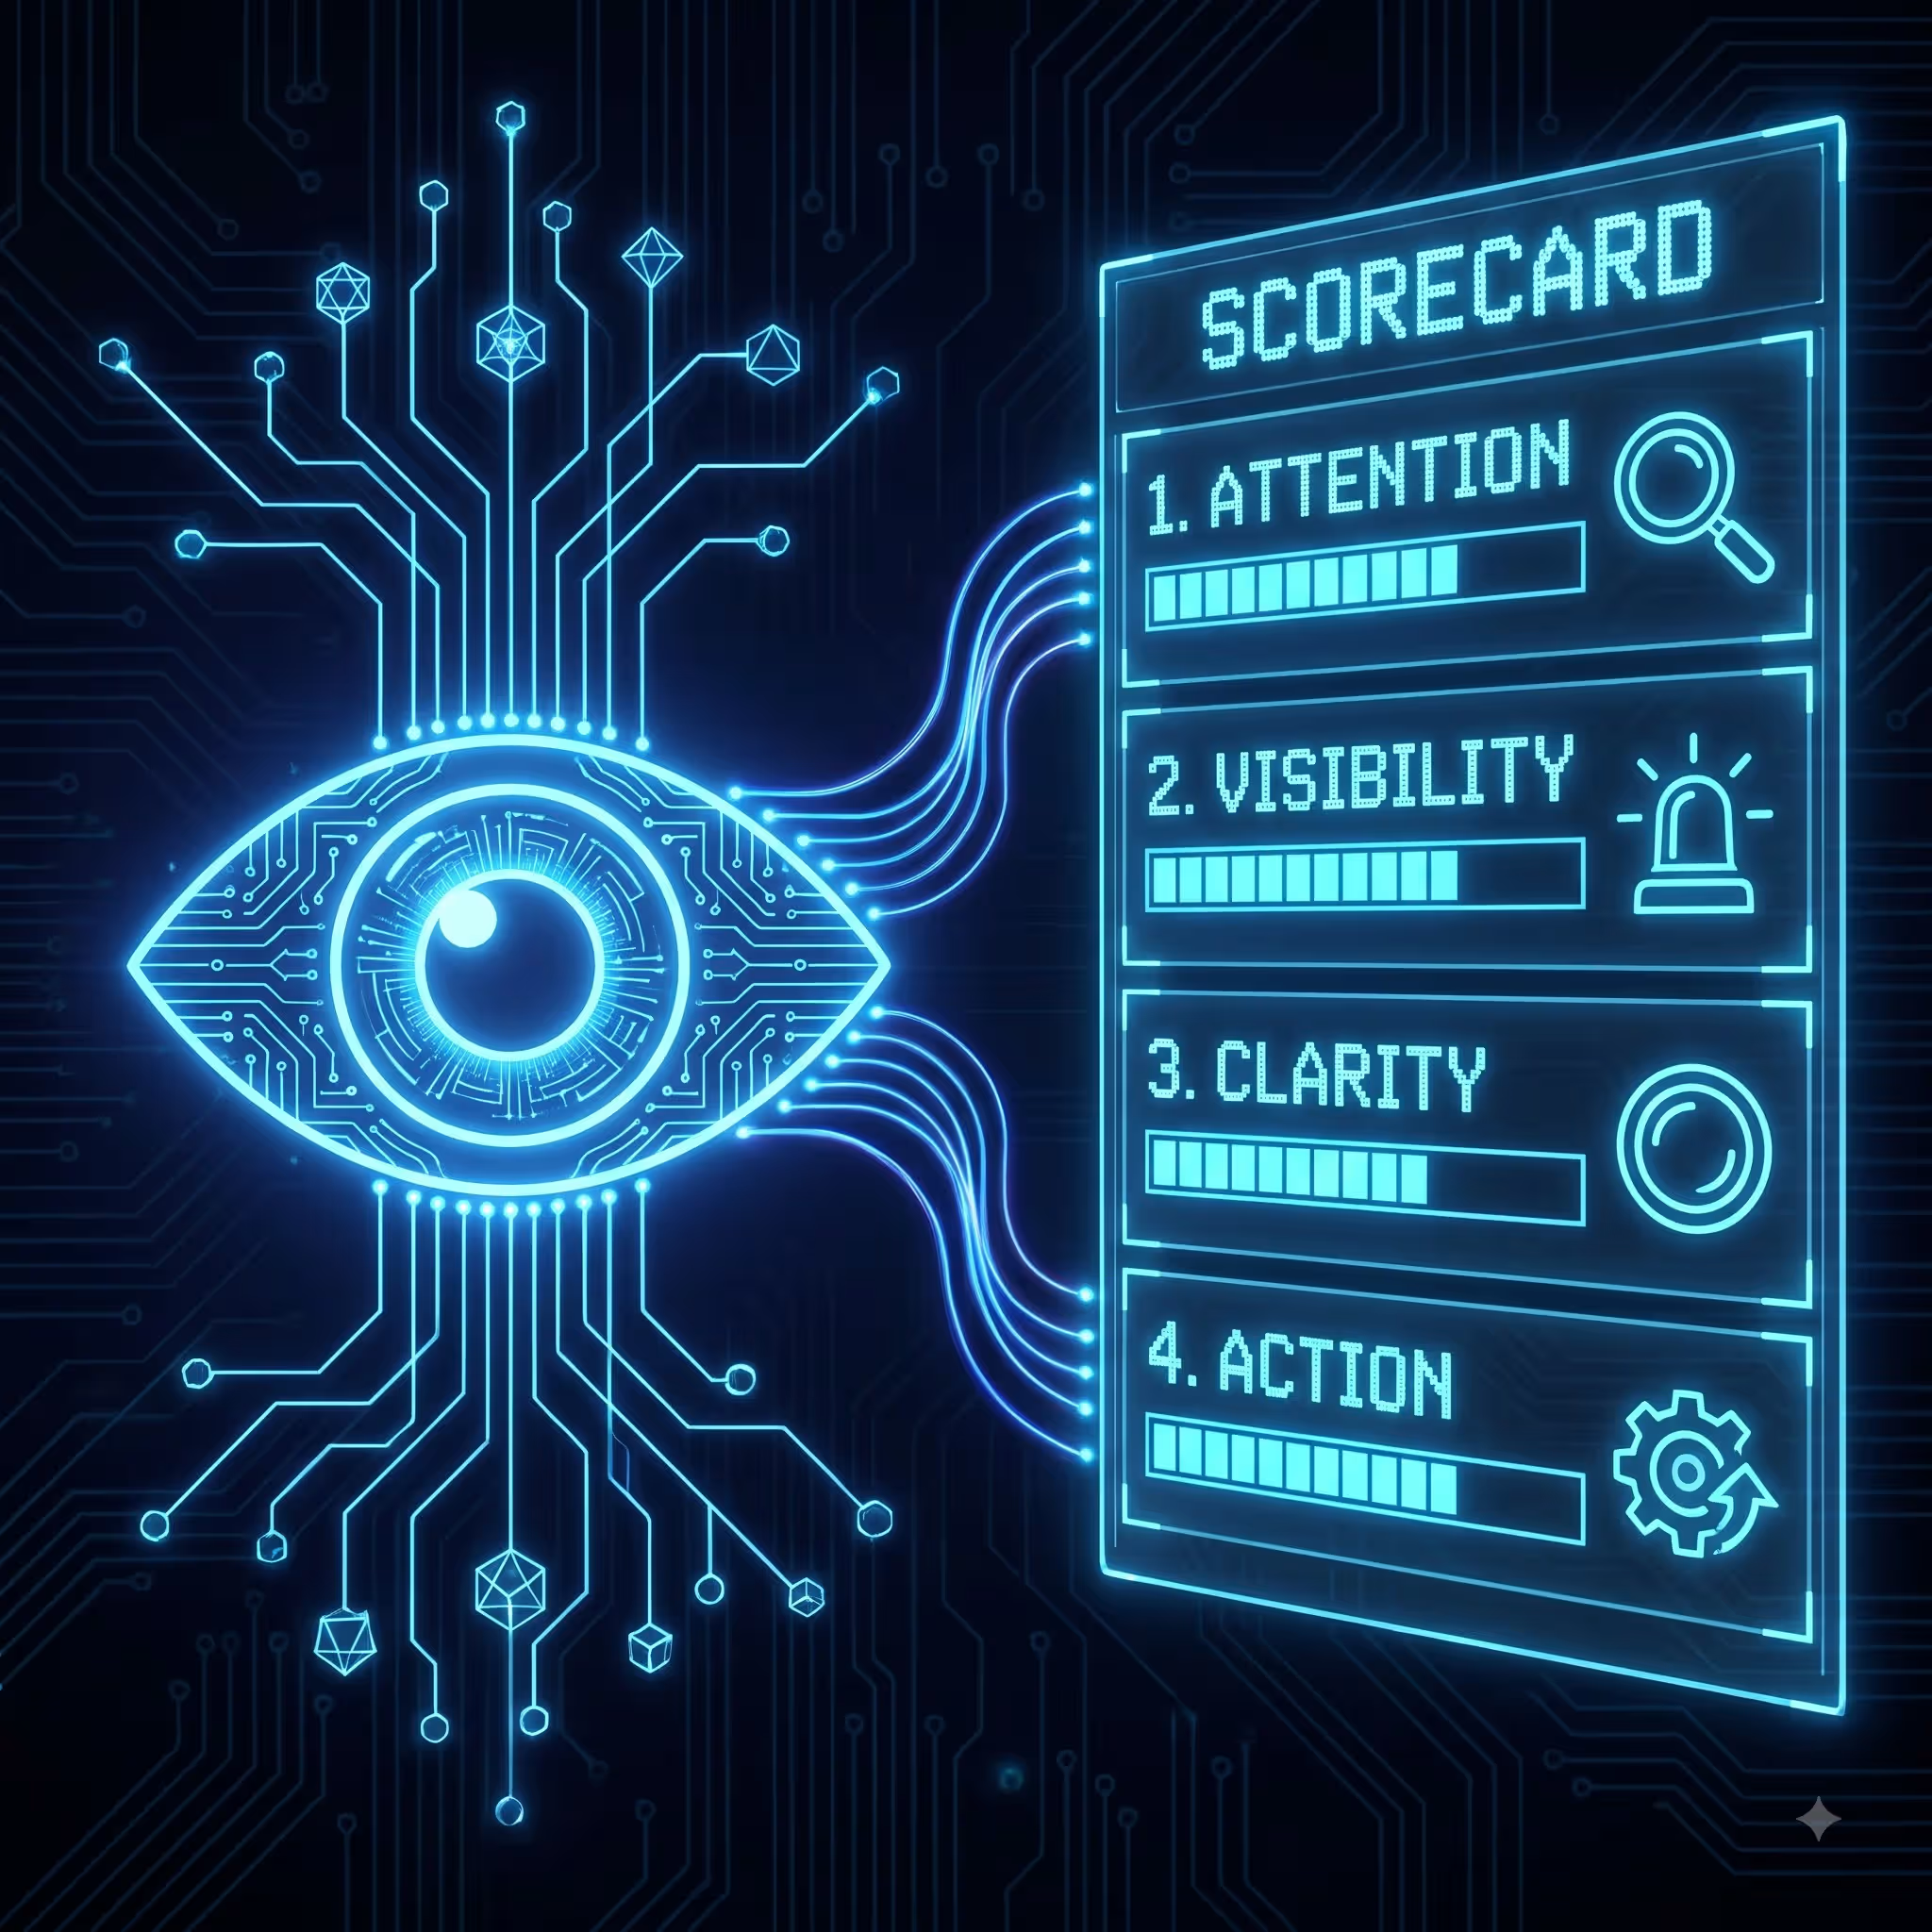
How It Works
Traditional metrics reward presence. A billboard counts as a success if it was "up" for 30 days. A digital ad succeeds if it was "served" a million times. These metrics measure logistics, not impact. They count what was delivered, not what was received.
AVI 2.0 shifts the focus to human response. An ad only creates value if it completes a journey: from being present, to being seen, to being understood, to being acted upon. It recognizes that each of these steps represents a potential point of failure. By scoring each step from 0 to 10 and averaging them, AVI 2.0 gives us a single, honest number that tells us not just if the ad was there, but how well it performed its intended job of human communication.
Real-Life Example
Consider a coffee shop's digital ad in a bustling subway station concourse. The screen is bright and visible. Thousands of commuters stream past it every hour. The old metric would be "50,000 impressions per day." AVI 2.0 asks a more meaningful series of questions: Of those 50,000 people, how many even turned their head toward it? Of those who looked, how long did their gaze linger, was it a dismissive flicker or a moment of consideration? For those who considered it, was the message ("Artisan Coffee, 100m Left") instantly clear, or did they have to puzzle it out? And finally, did any of that consideration translate into action, a change in direction toward the shop, or a saved mental note for later?
AVI 2.0 doesn't just count the crowd; it measures the conversation within it.
Example Breakdown
Let's analyze that coffee shop ad over a one-hour morning period:
Attention: An AI camera system measures an average gaze duration of 2.8 seconds. For a transit corridor context, the target is 3.0 seconds. Score: 9.3 (It captured strong, near-target attention).
Visibility: 1,500 people passed within view. The camera detected that 420 of them made a valid glance (over 0.5 seconds). Score: 7.1 (A decent proportion noticed it).
Clarity: The message is simple: a coffee cup icon, the text "5-Minute Walk," and an arrow. A Cognitive Load Metric (CLM) analysis scores it as very easy to process (CLM 1.5). Score: 8.5 (Clarity Score = 10 - 1.5).
Action: A unique QR code on the ad was scanned 15 times. Score: 6.0 (A modest but real response rate).
Calculation:
(9.3 + 7.1 + 8.5 + 6.0) ÷ 4 = 30.9 ÷ 4 = 7.7
Interpretation
A score of 7.7 out of 10 means the ad is genuinely effective, it’s capturing attention, being seen, and is clear. However, the "Action" score is the clear weak point. The math isn't just a final judgment; it's a diagnostic tool. It guides us to ask: How could we improve the call-to-action? Perhaps a bolder offer ("First Coffee Free") or a more prominent QR code would lift that 6.0 to an 8.0, raising the overall AVI to a stellar 8.4. This is measurement that leads directly to better advertising.